> For the complete documentation index, see [llms.txt](https://docs.wrangle.io/llms.txt). Markdown versions of documentation pages are available by appending `.md` to page URLs; this page is available as [Markdown](https://docs.wrangle.io/reporting/ticket-reporting.md).
# Ticket Reporting
The [Ticket Reports](https://slack.wrangle.io/tickets/reports) shows you an overview of your inboxes' KPIs. See trends in your ticket volume, including average and median time to completion, find out who your top requesters are, and review agent performance.
[Ticketing admins, agents, and observers](/tickets/setting-up-your-inbox/roles-and-permissions.md) have permissions to view reports.
{% hint style="info" %}
The Ticket Reports requires at least eight weeks of ticket data in order to effectively display trends.
If you want to see the data that these KPIs are based on, export your ticket history for the full dataset.
{% endhint %}
## Report Types
Ticket reporting includes 4 types of reports: Overview, agents, deflections, and Ask Wrangle.
### Overview:
Your report will have several inbox-wide metrics including:
* **Ticket Volume**
* **Top 5 Requesters**
* **Tickets Created**
* **Tickets Completed**
* **Average Ticket First Response Time**
* **Average Ticket First Completion Time**
* **Average Ticket Completion Time**
* **Median Ticket Completion Time**
* **Top Tags**
* **Least Used Tags**
Additionally, if any of your inboxes has [satisfaction surveys enabled](https://docs.wrangle.io/tickets/setting-up-your-inbox#setting-up-automations), your report will also include these two metrics:
* **Average Ticket Satisfaction Score**
* **Total Ticket Satisfaction Surveys Completed**
### Ticket report filters
By default the ticket report shows data for the **current week** across all inboxes, tags, and workspaces. You can use the following filters to customize the report:
* **Date Range** - Including preset options such as "30D", or any custom date range.
* **Inbox** - Drill down into one or more specific inboxes
* **Tags** - Select one or more [tags](/tickets/setting-up-your-inbox/tags.md) to view topic-specific trends
* **Priority** - Filter your reports down to the priorities you want to analyze.
* **Form Fields** - Filter reports with up to 3 form fields' values
* **Workspaces** - Drill down into data for specific Slack Connect workspace (for [customer support inboxes](/tickets/ticketing-for-slack-connect.md) only)
### Quickly apply date ranges
The date range picker in ticket reports supports the following presets:
* **Today**
* **Yesterday**
* **7D** — last 7 days
* **30D** — last 30 days
* **3M** — last 3 months
* **Custom** — pick a specific start and end date using the calendar
When no custom range is selected, reports default to the **last completed week** (not the current in-progress week).
View your organization's performance over the last 7 days quickly by hitting the "7D" button
### Date range comparisons
When a date range is selected, a **Compare** button appears next to the date picker. Clicking it lets you overlay a second time period on the report to compare performance side by side.
#### Comparison period options
* Previous Day
* Previous Week
* Previous Month
* Previous Quarter
Hover over each day to get a breakdown of each day's ticket count.
#### What gets compared
**Summary cards** (Tickets Created, Tickets Completed, completion times, first response time, assignment time, CSAT) show:
* The current period's value
* A percentage change indicator (up or down) labeled "over previous period"
**Charts** display both periods simultaneously:
* The current period is shown in solid bars
* The comparison period is shown in striped bars
### Filtering by tags
A **Tags** filter is available in the report filter menu. You can select one or more tags to limit the report to tickets that have those tags applied.
#### View your most used and least used tags
When no tag filter is active, the report includes a **Tag Usage** section with two charts:
* **Top Tags** — the most frequently used tags, broken down by inbox
* **Least Used Tags** — the least frequently used tags, broken down by inbox
### Filtering by form fields
A **Form Fields** filter is available in the report filter menu. You can filter tickets based on the values submitted in form fields.
#### How it works
1. Select a form field from the dropdown
2. Choose an operator:
* **Contains** — field value includes the text
* **Contains all** — field value includes all specified values
* **Does not contain** — field value does not include the text
* **Equals** — field value exactly matches
* **Is empty** — field has no value
3. Enter a value to match (not required for **Is empty**)
You can add up to **3 form field filters** at once. Multiple filters are combined with `AND` logic — tickets must match all filters to be included.
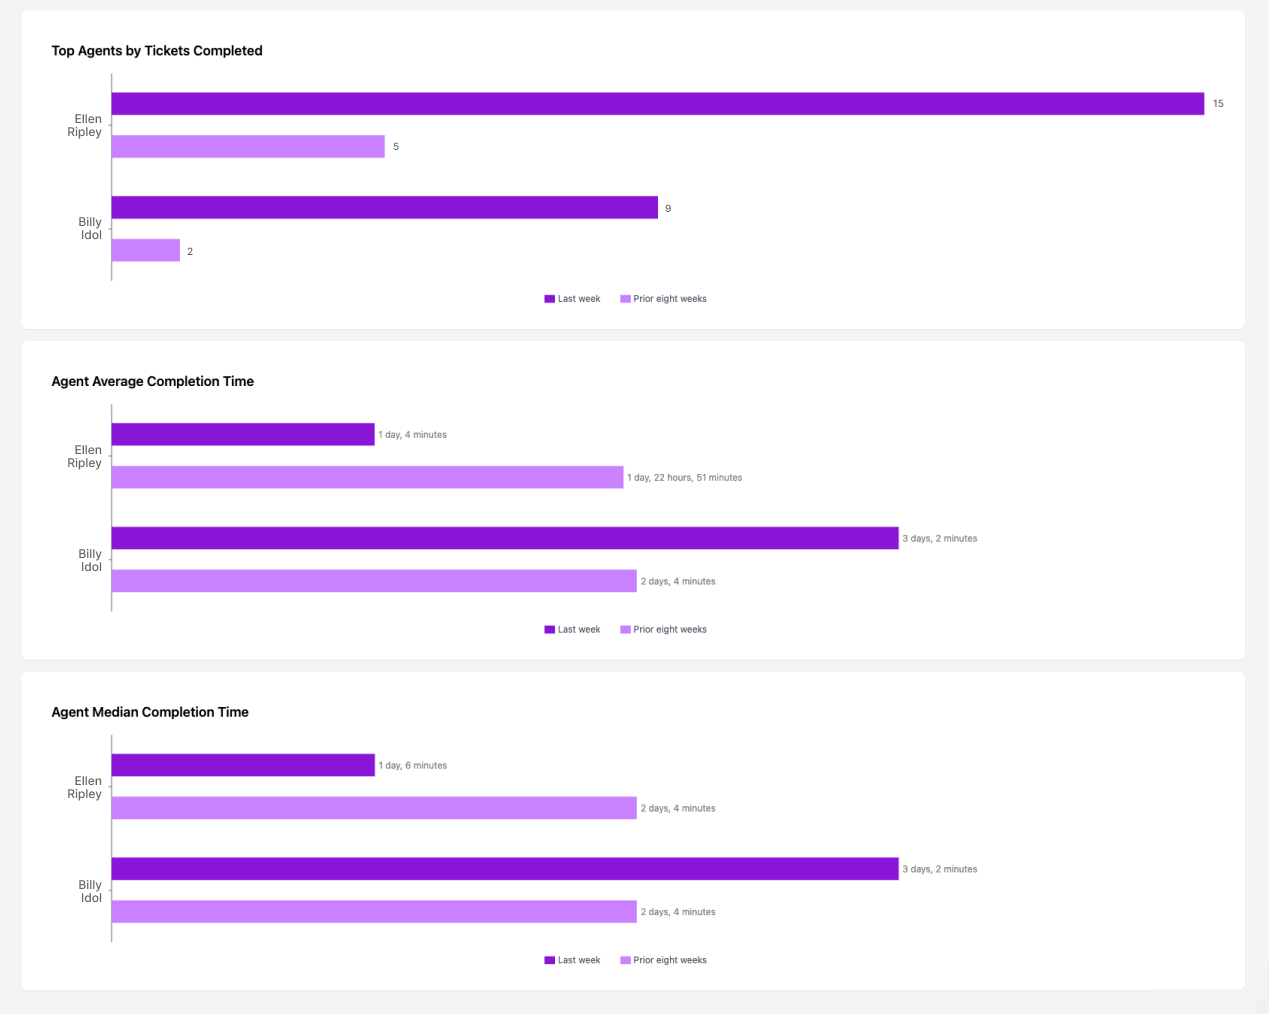
### Agents:
Your report will also include individual agent KPIs like:
Agent KPIs in the ticket report
* **Top Agents by Tickets Completed**
* **Agent Average Completion Time**
* **Agent Median Completion Time**
### AI Deflection reporting:
{% content-ref url="/pages/BWsFMsZ5YOJW0CTlJAwS" %}
[AI Deflection reports](/reporting/ticket-reporting/ai-deflection-reports.md)
{% endcontent-ref %}
### Leverage AI to analyze your metrics with Ask Wrangle:
{% content-ref url="/pages/DAT12N2zMuQyqGAtR1Zm" %}
[Ask Wrangle](/reporting/ask-wrangle.md)
{% endcontent-ref %}